1 Introduction
Modelling human perception of music similarity is an enduring challenge in the field of Music Information Retrieval. Methods employing Mel Frequency Cepstral Coefficients have been proposed for this purpose, however such methods largely ignore the temporal ordering of sonic events and rely instead on the statistical frequency of audio features to provide a measure of musical similarity; but how can we actually define music similarity? Such a subjective and abstract idea is challenging to articulate. Colloquially speaking, music similarity references a laundry list of notions. From performance style to rhythmic complexity, perhaps harmonic progression or melodic variation, quite possibly timbral content and tempo; and the list goes on. Still, behind this ambiguity, we can be sure that the pith of any similarity judgement is rooted in cognition.
In order to conceive an effective computational model of what music similarity is, human cognition and perception must be taken into consideration. What information is essential to our formation of complex auditory scenes capable of affecting temperament and disposition? Further exploration into these questions will inevitably bring about a richer and more perceptually relevant computational model of music. Attempting to actualise machines capable of auditioning music similar to humans can only enhance our endeavour of understanding what it means to hear music.
1.1 Motivation
Sound has always been an integral component in the successful proliferation of our species. Our auditory systems have evolved over hundreds of thousands of years with specific temporal acuities (Wolpoff et al., 1988). For instance, sudden onsets of rapidly dynamic sounds trigger feelings of anxiety and unpleasantness (Foss et al., 1989). Our brains are hardwired to interpret specific patterns of sound as indicative of dangerous or threatening circumstances (Halpern et al., 1986). Sensitivities to temporally ordered aural information has thus proven beneficial to our survival (Burt et al., 1995).
We must therefore recognize the importance that temporal information might play in our perception of music; a phenomenon based entirely in and of sound. Rhythm organizes the movement of musical patterns linearly in time and repetitive sequences, absolutely dependent on temporal relationships, are vital for perceived musical affect (Hevner, 1936). In fact, sequential repetition has been shown to be of critical importance for emotional engagement in music (Pereira et al., 2011). The perceptual bases of musical similarity judgements correlate strongly with temporal tone patterns and spectral fluctuations of said tones through time (Grey, 1977), while significant musical repetitions are crucial to metrical and contrapuntal structure (Temperley, 2001).
With this in mind, we seek a system capable of integrating temporal information into an appraisal of musical similarity. This research presents the implementation of a musical similarity system designed chiefly around this tenet along with supporting experimental and perceptual data corroborating its efficacy.
2 “Bag-of-Frames”
Mel Frequency Cepstral Coefficients are a widely employed tool for speech processing. MFCCs essentially present the spectral shape of a sound. Through some basic domain manipulation and a Fourier-related transform (DCT), the MFCC can drastically reduce the overall amount of raw data, while maintaining the information most meaningful to human perception (i.e., Cepstrum is approximately linear for low frequencies and logarithmic for higher ones) (Oppenheim, 1969). However, speech and music, while similar in certain communicative aspects, differ widely in most dimensions (Margulis, 2013). So, it is useful to ask why the MFCC has proven to be so useful in modelling music.
The MFCC is a computationally inexpensive model of timbre (Terasawa et al., 2005). Studies have shown that there is a strong connection between perceptual similarity and the (monophonic) timbre of single instrument sounds (Iverson & Krumhansl, 1993). Polyphonic timbre has also been shown to be perceptually significant in genre identification and classification (Gjerdingen & Perrott, 2008). However, most MFCC models disregard temporal ordering, they are static. They describe the audio as a global distribution of short-term spectral information (Aucouturier et al., 2007), much like a histogram would describe the distribution of colours used in a painting.
2.1 Evolution
Initially proposed by Foote (1997), use of the MFCC as a representative measure of musical similarity has seen several innovative modifications. Refining Foote’s global clustering approach, Logan & Salomon (2001) propose a localised technique where the distance between two spectral distributions (mean, covariance, and cluster weight) is seen as a similarity measurement and computed via Earth Movers Distance (EMD). EMD evaluates the amount of work \({ d_{p_i q_j}}\) required to convert one model into the other as well as the cost of performing said conversion \({ f_{p_i q_j}}\). Here, work is defined as the symmetrised KL-divergence, a measurement of distance between distributions (Rubner et al., 2000).
$$ \begin{equation} EMD(P,Q) = \frac{ \sum_{i=1}^{m} \sum_{j=1}^{n} d_{p_i q_j}f_{p_i q_j}}{\sum_{i=1}^{m} \sum_{j=1}^{n}f_{p_i q_j}} \end{equation} $$The next prominent contribution, set forth by Aucouturier & Pachet (2002), uses a Gaussian Mixture Model (GMM) in synchrony with Expectation Maximisation (initialised by k-means) for frame clustering. Ultimately, a song is modelled with three 8-D multivariate Gaussians fitting the distribution of the MFCC vectors. Similarity is assessed via a symmetrised log-likelihood of (Monte-Carlo) samples from one GMM to another.
$$ \begin{equation} si{m_{a,b}} = \;\frac{1}{2}\;\left[ {p\left( {a{\rm{|}}b} \right) + \;p\left( {b{\rm{|}}a} \right)} \right] \end{equation} $$Mandel & Ellis (2005) simplified the aforementioned approach and modelled a song using a single multivariate Gaussian with full covariance matrix. The distance between two models, considered the similarity measurement, is computed via symmetrised KL-divergence. In the following equation, \({\theta_i,_j}\) are Expectation Maximized parameter estimations of the mean vectors and full covariance matrices (Moreno et al., 2004).
$$ \begin{equation} D[p(x|\theta_i),p(x|\theta_j)]=\int \nolimits_{-\infty}^{\infty} p(x|\theta_i) log \frac{p(x|\theta_i)}{p(x|\theta_j)} dx + \int \nolimits_{-\infty}^{\infty} p(x|\theta_j) log \frac{p(x|\theta_j)}{p(x|\theta_i)} dx \end{equation} $$While each of these advances represent simplifications of the model as well as an increase in computational efficiency (i.e., a decrease in computation time), the results from each are similar. Therefore, it appears that a system based solely on the MFCC alone is ultimately bounded despite various computational approaches or modifications (Aucouturier et al., 2007).
2.2 Upper Bound
The MFCC-based similarity model has since seen several parameter modifications and subtle algorithmic adaptations, yet the same basic architecture pervades (Aucouturier et al., 2007). Front-end adjustments (e.g., dithering, sample rate conversions, windowing size, etc.) have been implemented in conjunction with primary system variations (e.g., number of MFCCs used, number of GMM components to a model, alternative distance measurements, Hidden Markov Models over GMMs, etc.) in an attempt towards optimisation (Aucouturier et al., 2004).
Nonetheless, these optimisations fail to provide any significant improvement beyond an empirical upper bound (Aucouturier et al., 2000; Pampalk et al., 2005). The simplest model (single multivariate Gaussian) has actually been shown to outperform its more complex counterparts (Mandel & Ellis, 2005). It would appear that results from this approach are bounded which suggests the need for an altogether new interpretation.
Notably, bag-of-frames systems ignore the temporal ordering of audio events in favor of a purely statistical description. It is quite possible, even likely, that a frame appearing with very low statistical significance contains information vital for perceptual discernment. Hence, this engineering adaptation towards modelling human cognition is not ideally equipped for polyphonic music and future enhancements will ultimately result from a more complete perceptual and cognitive understanding of human audition (Aucouturier et al., 2007).
2.3 Implementation
The following sections will explore the implementations and results of three MFCC-based bag-of-frames similarity systems. Beginning with the standard, wholly static instantiation (i.e., zero temporal or fluctuating spectrotemporal information), we proceed to system instantiations incorporating ΔMFCCs and temporal patterns as enhancements to the standard model.
2.3.1 Single Multivariate Gaussian
In the initial, completely static model, we segment the audio into 512-point frames with a 256-point hop (equating to a window length of 23ms at a sample rate of 22050Hz) (Mandel & Ellis, 2005). From each segmented frame, we extract the first 20 MFCCs as follows:
- Transform each frame from time to frequency via DFT \({S_i(k)}\), where \({ s_i(n)}\) is our framed, time based signal, h(n) is an N sample long Hanning window, and K is the DFT length. $$ \begin{equation} S_i(k)=\sum \nolimits_{n=1}^{N} s_i(n)h(n)e^{-j2\pi n / N} 1\leq k \leq K \end{equation} $$
- Obtain the periodogram-based power spectral estimate \({P_i(k)}\) for each frame. $$ \begin{equation} P_i(k)= \frac{1}{N} |S_i(k)|^2 \end{equation} $$
- Transform the power spectrum along the frequency axis into its Mel representation consisting of triangular filters [M(f)], where each filter defines the response of one band. The centre frequency of the first filter should be the starting frequency of the second, while the height of the triangles should be 2/(freq. bandwidth). $$ \begin{equation} M(f) = 1125 log_{10} (1 + \frac{f_{Hz}}{700}) \end{equation} $$
- Sum the frequency content in each band and take the logarithm of each sum.
- Finally, take the Discrete Cosine Transform on the Mel value energies, which results in the 20 MFCCs for each frame.
Next, we compute a 20x1 mean vector and a 20x20 covariance matrix and model a single multivariate Gaussian from the data. This process is repeated over every song in the database while a for loop iterates over each model, calculating the symmetrised KL-divergence (Mandel & Ellis, 2005).
2.3.2 Two Multivariate Gaussians
This model, proposed by De Leon & Martinez (2012), attempts to enhance baseline MFCC performance with the aid of some dynamic information (i.e., its time derivative, the ΔMFCC). The novelty here is in the modelling approach towards the ΔMFCCs. As opposed to directly appending the time derivatives to the static MFCC information, an additional multivariate Gaussian is employed.
The motivation here being the simplification of distance computations required to ultimately quantify similarity (i.e., symmetrised KL-divergence). For a d-dimensional multivariate normal distribution (N) described by an observation sequence (x), a mean vector (μ), and a full covariance matrix (Σ),
$$ \begin{equation} N(x|\mu,\Sigma) = \frac{1}{\sqrt{|\Sigma| 2\pi^d}} e^{-{\frac{1}{2}}(x-\mu)^T \Sigma^{-1}(x-\mu)} \end{equation} $$there exists a closed form KL-divergence of distributions p and q (Penny, 2001):
$$ \begin{equation} 2KL(p||q) = log \frac{|\Sigma_q|}{|\Sigma_p|} + Tr(\Sigma_p^{-1} \Sigma_p) + (\mu_p-\mu_q)^T \Sigma_p^{-1} (\mu_p-\mu_q)-d \end{equation} $$where Σ now denotes the determinant of the covariance matrix.
In this approach, audio is segmented into 23ms frames and the first 19 MFCCs are extracted in the same fashion as previously described. A single multivariate normal distribution is then modelled on the 19x1 mean vector and the 19x19 covariance matrix. The ΔMFCC (d) at time (t) is then computed from the Cepstral coefficient (c) using a time window (Θ).
$$ \begin{equation} d_t = \frac{\sum \nolimits_{\theta=1}^{\Theta} (C_{t+\theta} - C_{t-\theta})}{2 \sum \nolimits_{\theta=1}^{\Theta} \theta^2} \end{equation} $$An additional Gaussian is modelled on the ΔMFCCs and the song is ultimately characterised by two single multivariate distributions. Symmetrized KL-divergence is used to compute two distance matrices; one for the MFCCs and one for the ΔMFCCs. Distance space normalization is applied to both matrices and a full distance matrix is produced as the result of a weighted, linear combination of the two (De Leon & Martinez, 2012).
2.3.3 Temporal Patterns
To augment the standard MFCC effectiveness, Pampalk (2006) suggests the addition of some dynamic information correlated with the musical beat and rhythm of a song. Temporal patterns (coined “Fluctuation Patterns” by Pampalk) essentially attempt to describe periodicities in the signal and model loudness evolution (frequency band specific loudness fluctuations over time) (Pampalk et al., 2005). To derive the TP’s, the Mel-spectrogram is divided into 12 bands (with lower frequency band emphasis), and a DFT is applied to each frequency band to describe the amplitude modulation of the loudness curve. The conceptual basis of this approach rests on the notion that perceptual loudness modulation is frequency dependent (Pampalk, 2006). Implementation of the system is as follows:
- The Mel-spectrum is computed using 36 filter banks and the first 19 MFCCs are obtained from 23ms Hanning windowed frames with no overlap.
- The 36 filter banks are mapped onto 12 bands. Temporal patterns are obtained by computing the amplitude modulation frequencies of loudness for each frame and each band via DFT.
- Finally, the song is summarised by the mean and covariance of the MFCCs in addition to the median of the calculated temporal patterns.
3 Sequential Motif Discovery
At its inception, the sequential motif system was designed with the aim of identifying, quantifying, and ultimately extracting expressive, humanistic lineaments from performed music. The motif-discovery tool provides a more fine-grained analysis of musical performance by overlooking some of the large-scale features captured by the MFCC methods (e.g., global spectral density). We chose to include our system in the present analysis as an example of an approach that elevates temporal evolution of musical structure to a primary role.
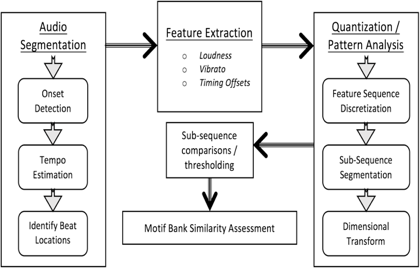
Coalescing spectrally extracted features with temporal information, our approach characterises a song by frequently recurring temporal patterns (motifs). These motifs are encoded into strings of data describing extracted features and serving as a stylistic representation of a song. The encoded string format enables us the luxury of sequence alignment tools from bioinformatics. Similarity is quantified as the amount of overlapping motifs between songs. The system is composed of three major units; audio segmentation, feature extraction, and quantisation/pattern analysis (Fig. 1).
3.1 Audio Segmentation
In this module, with the aid of an automatic beat-tracking algorithm, we segment the audio into extraction windows demarcated by musically rhythmic beat locations (Ellis, 2007). Each window subsequently consists of the audio interval between two beat locations. The procedure is as follows:
- Estimate the onset strength envelope (the energy difference between successive Mel-spectrum frames) via:
- STFT
- Mel-spectrum transformation
- Half-wave rectification
- Frequency band summation
- Estimate global tempo based on onset curve repetition via autocorrelation.
- Identify beats as the locations with the highest onset strength curve value. Ultimately, the beat locations are decided as a compromise between the observed onset strength locations and the maintenance of the global tempo estimate.
3.2 Feature Extraction
Essentially, each extraction window serves as a “temporal snapshot” of the audio, from which quantitative measurements corresponding to perceptually relevant (loudness, vibrato, timing offsets) features are extracted. Each representation of genre and/or expressive performance style (e.g., the abiding loudness levels pervading rock and hip-hop, vibrato archetypical of the classical styles, the syncopations of jazz, reggae, and the blues). Feature extraction occurs as follows:
- Loudness here \({v_L}\) is defined as the sum of all constituent frequency components in an STFT frame \({S_m(i,k)}\) and computed as the time average (i.e., the total number of frames in the extraction window, M) of logarithmic perceptual loudness. $$ \begin{equation} v_L = \sqrt{\frac{1}{M} \sum \nolimits_{i=1}^{M} [\sum \nolimits_{k=1}^{K} S_m^2(i,k)]} \end{equation} $$
- The vibrato detection algorithm (an instantiation of McAulay-Quatieri analysis) begins by tracking energy peaks in the spectrogram. From these peaks, several conditional statements are imposed onto the data. Upon conditional satisfaction, vibrato is recognized as being present in the extraction window. In short, the algorithm begins from a peak frequency frame(i)/bin(m) location [i.e., f(i,m)], and compares values in subsequent frame/bin locations [f(j,n)] in an attempt to form a connection path (rising or falling) identifiable as vibrato. A more detailed algorithmic explanation can be found in McAulay & Quatieri (1986).
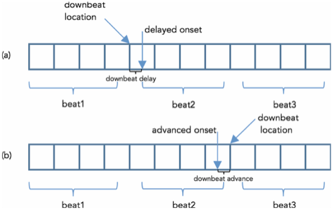
- Timing offsets are identified as deviations between the aforementioned derived beat locations and significant spectral energy onsets. They symbolise the superimposition of rhythmic variations upon the inferred beat structure. Each extraction window is segmented into four equal-length evaluation sections. The upbeat is identified by the left, outermost edge, while the downbeat is located on the boundary shared between the second and third sections. Onsets located in either of the first two sections are correlated with the upbeat, while onsets occupying either of the latter sections are downbeat associated. The timing offset is seen as the Euclidean distance from the up(down) beat location to the onset. A cursory illustration can be seen in Fig. 2, while a comprehensive description of the implementation can be found in Ren & Bocko (2015).
3.3 Quantisation/Pattern Analysis
In this module, the extracted features are discretized into symbolic strings and segmented further to facilitate motif discovery. Additionally, a dimensionality compression algorithm converts our symbol strings into the 1-D sequences required by our bioinformatics alignment tools. The procedure is as follows:
- To produce the quantisation codebook, we take our continuous feature sequence s(n), sort the values in ascending order s'(n), and apportion them into Q equal sets. The max/min values of each set dictate the thresholds for each quantisation division.(1) The discretized feature sequence is equal in length to the number of extraction windows obtained in the audio segmentation module.
- A sliding mask M is applied to the feature sequence, creating multiple sub-sequences, expediting pattern analysis. The sliding value is one data point and the overlap value of each subsequence is three data points.
- To convert our 3-D feature value strings into 1-D symbols while maintaining chronological evolution, the following transform (where d is the feature dimension and \({S_{q}}\) is the quantised value of said data point) is used: $$ \begin{equation} S_{qi} = (d-1)Q+S_q \end{equation} $$
- At this point, we have, on average, ~10K, 1-D, sub-sequences. Here, we use the sequence alignment tools of Hirate & Yamana (2006). Succinctly, each sub-sequence (of length=M) is compared to every other sub-sequence, to verify if and when the pattern recurs. If the motif recurs more than a minimum threshold, this motif is accepted into the motif bank. The motif bank is the end model of the song and correspondence between motif banks could be a signal of similarity. The algorithm is highly customisable, allowing for various support values and time span intervals.
4 Evaluation
4.1 “Ground Truth”
Musical similarity is recognised as a subjective measure, however there is consistent evidence signifying a semi-cohesive similarity experience pervading diversified human listening groups (Berenzweig et al., 2003; Logan & Salomon, 2001; Pampalk, 2006). This is implicative of there being validity in utilising human listening as an evaluation of similarity. Nonetheless, objective statistics are revealing and must also be incorporated into the system appraisals.
To provide an equitable qualitative assessment of the systems’ performance, we adopt a multifaceted scoring scheme comprising three branches:
- Human Listening (BROAD score).
- Genre Similarity (Mean % of Genre matches).(2)
- F-measure over top three candidates.
4.2 Database and Design
The musical repository used in this research consists of 60 songs spanning the following genres; Rock, Singer/ Songwriter, Pop, Rap/Hip-Hop, Country, Classical, Alternative, Electronic/Dance, R&b/Soul, Latino, Jazz, New Age, Reggae, and the Blues. A geometrically embedded visualisation of a portion of the artist space according to their Erdös distances, a function of transitive similarity, can be seen in Fig. 3.
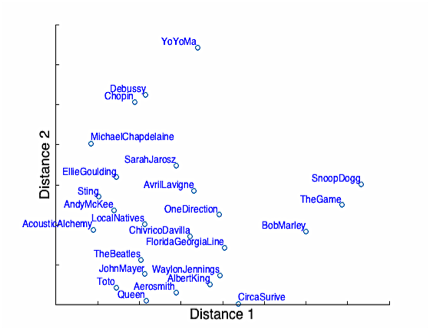
Erdös distance evaluates the relationship of two performers (A&B) as the number of interposing performers required to create a connection from A to B. Using the band Toto as an example, we begin with an Erdös number of zero. If Aerosmith is listed as a similar artist to Toto and to Queen, but Queen is not listed as a similar artist to Toto, then Aerosmith is given an Erdös number of one and Queen an Erdös number of two.(3)
The pool of 20 participants engaging in the listening experiments spans multiple contrasting musical preferences, age groups (19-63 yrs. of age), and backgrounds. Of the participants, three were musicians with professional performance experience, six were intermediate (“self-taught”) musicians, two were academically (collegiate level) trained musicians, and the remaining nine had little or no experience in composing or performing music.
The database is analysed using each of the four systems and distance matrices are computed correspondingly.(4) Each song from the set is used, in turn, as a seed query. Following the query (each listener hears three seed queries in total), the participants hear the top candidate from each system (i.e., each listener hears a total of 15, 30-second song snippets). The seed queries presented to the participants were randomised, as was the order in which the top system candidates were played. In the instance that multiple systems returned the same top candidate, the second candidates were used instead. For homogeneity, the chorus, “hook”, or section containing the main motive of the song was used as playback to the participants.
4.3 Results
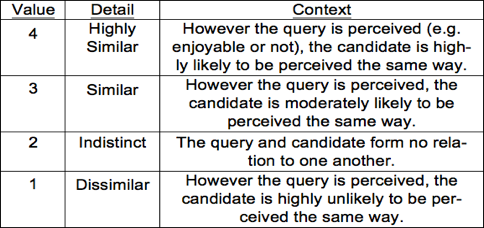
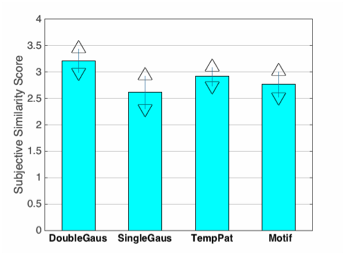
In regard to our BROAD scores, the performance of each algorithm is characterised by the mean value rating computed over every top candidate return. Each participant first hears a seed query. This is followed by each system’s top choice for the song in the database judged (by the system) to be most similar to the seed query. The participant then provides a subjectively perceptual rating (according to Tab. 1) for how similar each returned song is to the seed. Performance according to this metric is displayed in Fig. 4. Regarding genre similarity, system performance is quantified as the percentage of the time that the query seed and its 1st returned candidate are of the same genre. This metric is averaged for all seed queries over the entire database. Performance according to this metric is displayed in Fig. 5.(5)
F-measure, the harmonic mean of two classic information retrieval metrics, precision (P) and recall (R), communicates information regarding the accuracy and propriety of returned responses to a given query.
$$ \begin{equation} P = \frac{TruePositive}{TruePositive+FalsePositive} \end{equation} $$ $$ \begin{equation} R = \frac{TruePositive}{TruePositive+FalseNegative} \end{equation} $$ $$ \begin{equation} F_{measure} = \frac{2PR}{P+R} \end{equation} $$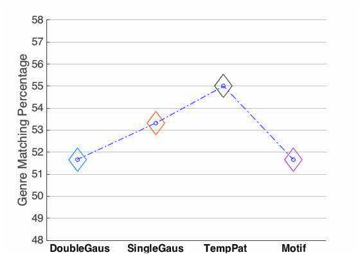
To qualify as a “True Positive”, a returned candidate must satisfy at least one of the following conditions:
- Be of the same genre as the seed.
- Be of the same artist as the seed.
- The seed and query share at least one similar artist.
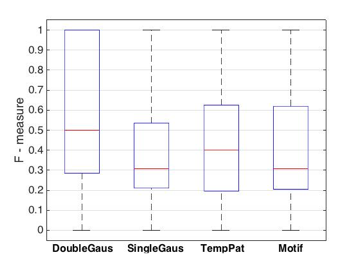
A “False Positive” is a returned candidate that does not satisfy any of the aforementioned criterion, while a “False Negative” is a candidate that does satisfy at least one of the conditions but was not returned. The best score the F-measure can achieve is 1, while the worst is 0. Our F-measure metric is computed over all possible seed queries. Performance according to this metric is displayed in Fig. 6.
5 Discussion
We have presented four different approaches for “measuring” musical similarity and compared their performance using the evaluation schemes described in Section 4.1. We must keep in mind that individual musical preferences are highly variable and influenced by a multitude of psychological, psychoacoustic and sociocultural factors.
However, what can be unambiguously interpreted from the data is that the inclusion of dynamic, temporal information improves system performance. This is clearly demonstrated by the human listening evaluation (BROAD score, Fig. 4). Each system that includes some form of temporal information (i.e., “DoubleGaus”, “TempPat”, “Motif”) returns recommendations that are judged by human listeners to be more perceptually similar than recommendations returned by the purely static model (i.e., “SingleGaus”).
This is also reflected in the F-measure (Fig. 6). The “DoubleGaus” system again has the most promising results with its median at 0.5 and 25% of its distribution taking on a perfect score of 1. Similarly, “TempPat” and “Motif” both demonstrate distributions with 3rd-quartiles above 0.6. The static model (i.e., “SingleGaus”) shares a median value of ≅ 0.3 with “Motif”, however 3rd-quartile comparisons favor the temporally based model (i.e., “Motif”).
It is worth noting that “TempPat” was able to consistently and accurately return genre matches in the Reggae and Jazz categories (Fig .5). This makes intuitive sense considering the added dynamic information within this model is strongly associated with the musical beat and rhythm of a song (Pampalk et al., 2006). Both Jazz and Reggae are known for atypical rhythmic structures and peculiar beat emphasis (i.e., syncopation).
Results from the F-measure and human listening tests are in general agreement, however this is not mirrored in the genre similarity evaluation scheme. The data shows the static MFCC approach has a positive correlation with “genre” similarity, while the inclusion of temporal information shows a positive correlation with subjective perceived similarity. This demonstrates an association between global timbre and the term “genre” and carries the implication that the MFCC, while quite capable of identifying the “broad-strokes” of similarity (i.e., “genre” categorisation), is perceptually enhanced with temporal information.
5.1 Conclusions and Future Work
This research serves as a testament to both the quality of pre-existing MFCC approaches and the significance temporal information plays in the perception of musical similarity. Perhaps, synthesising temporal aspects of our sequential analysis approach with global spectral information from the MFCC would produce a system with even greater potential for modelling perceived musical similarity.
References
- Aucouturier, J. & Pachet, F. (2000). Finding songs that sound the same. Proceedings of IEEE Benelux Workshop on Model-Based Processing and Coding of Audio, 1–8.
- Aucouturier, J. & Pachet, F. (2002). Music similarity measures: What’s the use? ISMIR.
- Aucouturier, J. & Pachet, F. (2004). Improving timbre similarity: How high’s the sky? Journal of Negative Results Speech Audio Science, 1, 1–13.
- Aucouturier, J., Defreville, B. & Pachet, F. (2007). The bag-of-frames approach to audio pattern recognition: A sufficient model for urban soundscapes but not for polyphonic Music. Journal of the Acoustical Society of America, 122(2), 881–891.
- Burt, J.L., Bartolome, D.S., Burdette, D.W. & Comstock Jr, R. (1995). A psychophysiological evaluation of the perceived urgency of auditory warning signals Ergonomics, 38, 2327–2340.
- Berenzweig, A., Logan, B., Ellis, D.P.W. & Whitman, B. (2003). A large-scale evaluation of acoustic and subjective music similarity measures. Computer Music Journal, 28(2), 63–76.
- De Leon, F. & Martinez, K. (2012). Enhancing timbre model Using MFCC and its time derivatives for music similarity estimation. 20th European Signal Processing Conference (EUSIPCO), IEEE, 2005–2009.
- Ellis, D.P.W., Whitman, B., Berenzweig, A. & Lawrence, S. (2002). The quest for ground truth in musical artist similarity. ISMIR.
- Ellis, D.P. (2007). Beat tracking by dynamic programming. Journal of New Music Research, 36(1), 51–60.
- Foote, J.T. (1997). Content-based retrieval of music and audio. SPIE, 138–147.
- Foss, J.A., Ison, J.R. & Torre, J.P. (1989). The acoustic startle response and disruption of aiming: I. effect of stimulus repetition, intensity, and intensity changes. Human Factors, 31, 307–318.
- Gjerdingen, R.O. & Perrott, D. (2008). Scanning the dial: The rapid recognition of music genres. Journal of New Music Research, 37(2), 93–100.
- Grey, J.M. (1977). Multidimensional perceptual scaling of musical timbres. Journal of the Acoustical Society of America, 61(5), 1270–1277.
- Halpern, D.L., Blake, R. & Hillenbrand, J. (1986). Psychoacoustics of a chilling sound. Perception and Psychophysics, 39, 77–80.
- Hevner, K. (1936). Experimental studies of the elements of expression in music. The American Journal of Psychology, 48(2), 246–268.
- Hirate, Y. & Yamana, H. (2006). Generalized sequential pattern mining with item intervals. Journal of Computers, 1(3), 51–60.
- Iverson, P. & Krumhansl, C.L. (1993). Isolating the dynamic attributes of musical timbre. Journal of the Acoustical Society of America, 94, 2595–2603.
- Li, T., Ogihara, M. & Tzanetakis. G. (2012). Music data mining. Boca Raton: CRC.
- Logan, B. & Salomon, A. (2001). A music similarity function based on signal analysis. IEEE International Conference on Multimedia and Expo, 2001, 745–748.
- Mandel, M. & Ellis, D. (2005). Song-level features and support vector machines for music classification. ISMIR, 594–599.
- Margulis, E.H. (2013). Repetition and emotive communication in music versus speech. Frontiers in Psychology
- McAulay, R.J. & Quatieri, T.F. (1986). Speech analysis/synthesis based on a sinusoidal representation. IEEE ICASSP, 34(4), 744–754.
- Moreno, P.J., Ho, P.P. & Vasconcelos, N. (2004). A Kullback-Leibler divergence based kernel for SVM classification in multimedia applications. Advances in Neural Information Processing Systems.
- Oppenheim, A.V. (1969). A speech analysis-synthesis system based on homomorphic filtering. Journal of the Acoustical Society of America, 45, 458–465.
- Pampalk, E., Flexer, A. & Widmer, G. (2005). Improvements of audio-based music similarity and genre classification. ISMIR (5), 634–637.
- Pampalk, E. (2006). Computational models of music similarity and their application in music information retrieval. PhD thesis, Vienna University of Technology.
- Penny, W.D. (2001). Kullback-Liebler divergences of normal, gamma, Dirichlet and Wishart densities. Wellcome Department of Cognitive Neurology.
- Pereira, C.S., Teixeira, J., Figueiredo, P., Xavier, J. & Castro, S.L. (2011). Music and emotions in the brain: Familiarity matters. PloS One, 6(11), e27241.
- Raś, Z. & Wieczorkowska, A.A. (2010). The Music Information Retrieval Evaluation EXchange: Some observations and insights. Advances in Music Information Retrieval, 93–114.
- Ren, G. & Bocko, M. (2015). Computational modelling of musical performance expression: Feature extraction, pattern analysis, and applications. PhD thesis, University of Rochester.
- Rubner, Y., Tomasi, C. & Guibas, L. (2000). The earth mover’s distance as a metric for image retrieval. International Journal of Computer Vision, 40, 99–121.
- Temperley, D. (2001). The cognition of basic musical structures. Cambridge, MA: MIT Press.
- Terasawa, H., Slaney, M. & Berger, J. (2005). Perceptual distance in timbre space. Proceedings of the International Conference on Auditory Display (pp. 61–68). Limerick: International Community for Auditory Display.
- Wolpoff, M.H., Smith, F.H., Pope, G. & Frayer, D. (1988). Modern human origins. Science, 241(4867), 772–774.
Footnotes
- In our implementation, we set Q to 3 as a compromise between computational efficiency and satisfactory data representation. Back to text
- Genres are allocated according to iTunes artist descriptions. Back to text
- Artist similarity data used in our measure was extracted from Last.fm. Back to text
- Our distance matrix is a symmetric 60x60 matrix containing the pairwise “distances” (i.e., number of overlapping motifs) between all songs in the database. After matrix normalisation, all entries on the main diagonal are set to zero, and all off-diagonal entries are positive values between zero and one. The closer the pairwise entry is to one, the more similar the songs are judged according to the Motif system. Back to text
- Experimental results (approximately 50% genre matching) yield statistical significance when considering all 14 possible genre classifications. Back to text
- Calculated utilising the compensatory formula for sample size less than 30 (i.e., T-score). By using a larger sampling of songs over a smaller group of participants, we attempt to avoid any systematic bias caused by possible ambiguous features of any given sample. Back to text
Author contacts
- Steven Crawford
- steven.crawford@rochester.edu
- University of Rochester
- Music Research Laboratory
- 14627, Wilson Blvd., Rochester, US
- Gang Ren
- gang.ren@rochester.edu
- University of Rochester
- Hajim School of Engineering & Applied Sciences
- 14627, Wilson Blvd., Rochester, US
- Mark F. Bocko
- mark.bocko@rochester.edu
- University of Rochester
- Department of Electrical and Computer Engineering
- 14627, Wilson Blvd., Rochester, US
