To listen to data… can be a surprising new experience with diverse applications ranging from novel interfaces... to data analysis problems.
Practical sonification techniques, such as that found in the electrocardiogram, alarm bell, telephone ring, or intermittent pulse of a radar device, have all found their uses in the modern world (Hermann et al., 2011; Vickers, 2011). However, as the quote above illustrates, auditory display of complex data is a growing field with many existing applications, including opportunities for new user experiences, or for approaches to data analysis which might not otherwise be possible solely via visual presentation.
The human auditory system is very good at detecting minute changes in audio signals and can also monitor several parallel audio streams at one time. This means hearing offers an exciting opportunity for parallel information interpretation tasks to complement existing visual representational techniques.
In particular the use of auditory display in biomedical data analysis is proving to be a fertile avenue for research (Jovanov et al., 1999; Visi et al., 2014). These types of datasets are often highly complex, and may involve multiple dimensionalities.
Auralizing these datasets enables casual listeners to experience patterns in the datasets, as well as facilitating multimodal analysis that might not otherwise have been possible by subject specialists. Multimodality is a complimentary human perceptual process which has been previously well-exploited by the bio-medical world (Jovanov et al., 1999; Mihalas et al., 2012; Toharia et al., 2014).
The idea behind sonification is that synthetic non-verbal sounds can represent numerical data and provide support for information processing activities of many different kinds.
There is a significant difference between purely utilitarian approaches to auditory display, and more calculated types of sonification wherein specific data-to-sound mapping strategies are employed in order to generate sounds according to aesthetic intentions, whether that be as fully realised soundscapes, or individual fragments of pieces. For a systematic review of sonification mapping strategies already in use with real world datasets, the interested reader is referred to Dubus & Bresin (2013). These mapping strategies can be approached from a purely creative standpoint, in order to generate interesting, aesthetically convincing, or even aesthetically challenging works of computer-aided (or indeed entirely computer-generated) composition. It is here that we can draw the distinction between sonification and musification. In a musification, the data will typically be subjected to a set of musical constraints. These might include rhythm and pitch quantisation, or more general rule sets concerning harmonic progressions. More advanced systems might include timbral or spatial mappings.
In longer perceptual tests, listeners tend to find music less fatiguing than test tones, noise, or speech signals (Bigand & Poulin-Charronnat, 2006), and musification has been shown to facilitate deeper engagement with complex multidimensional data in previous biomedical applications (Visi et al., 2014). Moreover, musification offers a distinct advantage over more direct mappings as might be exhibited in a sonification system, in that listeners are typically very familiar with the process of listening to music in their everyday lives, and therefore a certain amount of pre-training in terms of correlating data to listener responses can be assumed on the part of the listener as automatic and intuitive processes. This could also be seen as a hindrance in that listeners will almost certainly exhibit some degree of expectation bias with regards to what they hear within the context of creative approaches to computer music generation. For example, listeners may have similar overarching criteria that they expect would combine to make “pleasant” sounding music. “Pleasant” is a challenging, high level descriptor. Zwicker & Fastl (1999) proposed that pleasantness is comprised of an interrelationship between sharpness, roughness, fluctuation strength and tonalness, though this model of sensory pleasantness discards the listener’s preconceptions regarding the perceived sources or mental associations of stimulus sounds – in other words this perspective acknowledges that listeners will be prejudiced to certain types of sound above and beyond their pure acoustical pleasantness (therefore, pleasantness may have a duality of meaning to some listeners) (Ritossa & Rickard, 2004; Zwicker & Fastl, 1999).
At a lower ontological level listeners might have certain harmonic expectations, as are commonly exhibited in traditional modulation cycles and cadences – phenomena which have been well documented by the music psychology research community (Huron, 2006; Janata, 1995; Sears et al., 2014). These expectations afford the designer of the musification system the opportunity to exploit them for creative ends, perhaps by providing surprise synchronously with an unexpected change in the auralized data stream. In order to achieve a successful multimodal engagement, the mapping to musical features should be congruent without being distracting, such that the auditory stimulus augments the visual analysis. There, in the creative decision-making process, begins the trade-off between the utility of the auditory display, and the musicality of the resulting creation. If we consider the overarching mapping strategy to have hierarchical levels, perhaps with structure at the top and individual auditory features at the bottom, there are some levels which exhibit a direct correlation between utility and musicality. Returning to the example of pleasantness explored above, which can be considered a perceptual attribute in both a musicological sense (derived from structural features, such as repetition, mode, or tempo) and a psychoacoustic sense (derived by some combination of spectral and temporal factors), or as an attribute in a utilitarian sense (a more generic like or dislike in the listener). For an example of the latter, imagine being a data analyst who relied on auditory display to augment or entirely replace a visual data representation; this might mean being exposed to the auditory display for eight or more hours in a working day. Even anecdotally it is not difficult to see how this could become tiresome for the listener, if the design of the auditory display did not include a certain degree of novelty, and thus might be more of a hindrance than a help, as the inclusion of novelty for its own sake might be counter to an accurate representation of the actual data, particularly in cases of real time biomedical data analysis – this could be considered to be an indicator of compromised utility on the part of the auditory display design.
In order to consider utility in a musification, the context of the dataset must be reconciled with the creative intentions of the composer – or, depending on one’s wider philosophical perspective on the nature of authorship of music which has been mediated at some point in its generation by computer systems, the system designer. This issue has been explored in some depth by composers who create music in this manner, for example Dahlstedt who felt some conflict in this regard:
I have a slight feeling I did not write that music, and yet I am quite sure no one else did. I designed the algorithm, implemented it and chose the parameters, and still I feel alienated.
Designing the complexity of interactions between agents is a compositional act (emphasis: this author).
Regardless of the philosophical position regarding authorship, biomedical sonification and musification systems are additionally governed by certain constraints when contrasted with solely creative systems. Specifically, the principle of primum non nocerere (directly from the Latin, “firstly, do nothing noxious”, or more colloquially in modern medicine, “do no harm”) applies – in other words, any auditory display must not invalidate, or interfere with existing successful data representations (and their corresponding analysis techniques). In the case of the example above, introducing novelty where there is none in the dataset might cause harm (a distraction or perhaps a false diagnosis, compromising primum non nocere). Similarly we consider it essential that the auditory display is perceptually pleasant to listen to for long periods of time. We are less concerned about processing overhead (real-time implementation at this stage is not critical), but this is application dependent; in the context of a computationally expensive sonic alarm, for example, processing time and other such factors would have an influence on the utility of the auditory display, wherein a slow alarm would be axiomatically inappropriate.
In the context of a system for musifying high-throughput holography via high-throughput Fourier techniques, to allow cell-level movement to be studied in two and three dimensions such as the malaria parasites of the genus Plasmodium in a blood sample, or E. coli in drinking water (Wilson et al., 2011; Wilson et al., 2013), we can derive the following criteria:
Previous work has presented one such musification of biomedical data, specifically P. berghei micro-organism motility as shown in high resolution 3D holography (Williams & Wilson, 2015a). This system addressed a musification of the movement of a eukaryote parasite, P. berghei, from the Plasmodium genus. P. berghei is a form of the genus that transports malaria, but which cannot infect humans, and can therefore be useful when modelling the transmission of malaria under laboratory conditions. The P. berghei male is an isolated flagellum that exhibits a swimming behaviour in Newtonian fluids, with a characteristic anticlockwise motion. This can be problematic to analyse visually, partly due to the so-called bi-stability visual illusion (Parker & Krug, 2003), which is a well-documented difficulty in visually discriminating between clockwise and anticlockwise directions of movement. In terms of auditory perception this problem is in some respects analogous to Deutsch’s tritone paradox (Deutsch, 1986). Flagellar movement presents a related challenge in that their movement pattern is not readily resolved in two dimensions. Thus, 3-D holography offers the opportunity to capture the entirety of the flagellar movement, in a manner that is similar to wavelet transforms in the auditory domain (representations include frequency, amplitude, and most importantly, phase, allowing for the full wave to be captured and re-created)(2). Techniques for deriving other types of sound transformations based on these properties as extracted by holography have also been documented outside of the realm of auditory display (Olivero et al., 2012).
The next section presents an overview of a musification system that conforms to these criteria, along with a summary of an evaluation of its utility.
The basic premise of the musification in this system is that a multimodal representation of the flagellar movement might ultimately be of use, for example, in-field, to aid detection analysts, assuming that the auditory display will not compromise the visual analysis in any way, and will aid perceptual discrimination in the case of visual bi-stability (differentiating between clockwise and anticlockwise movement in the dataset). As well as the intention for a multimodal representation of the dataset, there is also the practical possibility of a “hands-free” application in difficult environments (for example, analysing water purity at the source “in-field”). Thus the musification was designed to include all the salient features of the visual analysis.
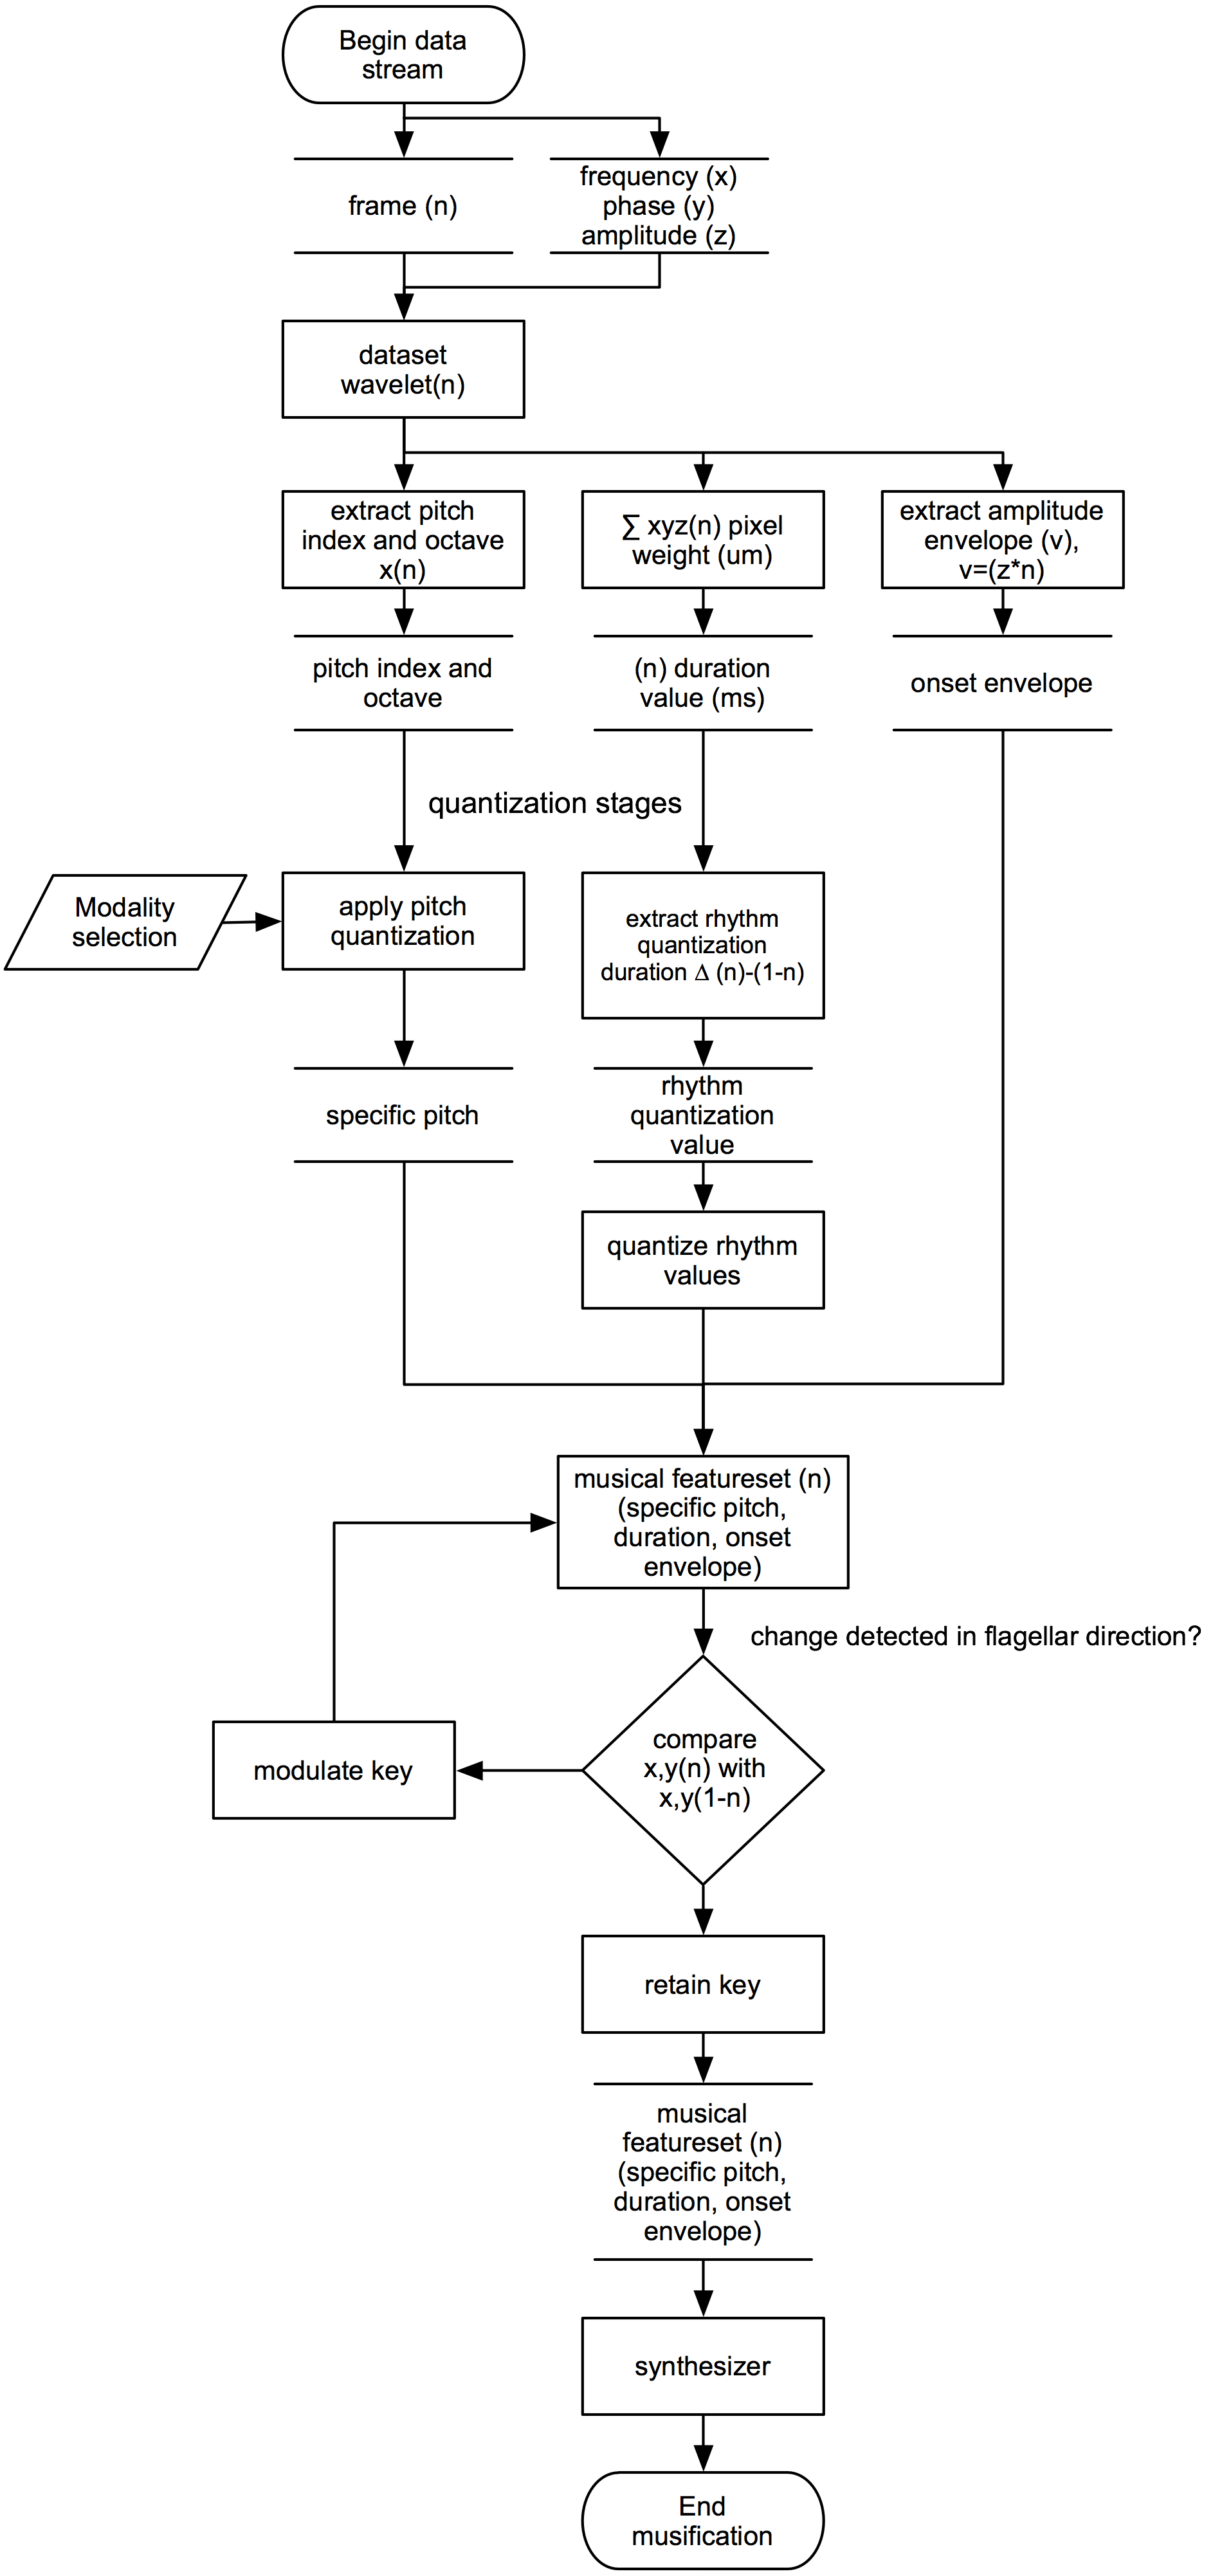
The complete system is detailed in Williams & Wilson (2015b) but the musical feature generation will be summarized here for the reader’s ease (for full details of the spatialisation algorithm and other data treatments the reader is referred to the reference above). The signal flow of the system is illustrated in Fig. 1, which shows the data stream being split into frames for analysis. As noted in Section 1.2, the source data is stored as a series of wavelets (a four-value array containing time, frequency, amplitude, and phase). These values are used to determine note pitches, durations and rhythmic properties in order to generate complete musical passages. Pitch values are quantised to scales and modes so that changes in the direction of movement can be represented by musical modulations. The resulting musical passages can be generated from the data in direct synchresis(3) to the visualisation of flagellar movement.
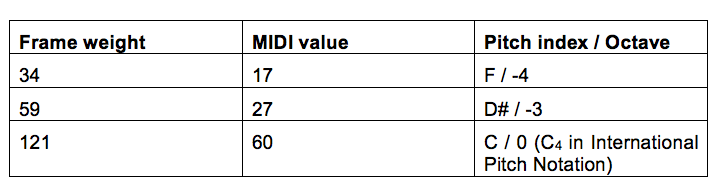
The first mapping in our example musification is to pitches. Pitches are assigned on a frame-by-frame basis according to a weighting (scaled from 1-255) from the data in each frame. Melodies are achieved by non-linearly mapping these values to MIDI notes in a series of ascending chromatic scales over 11 octaves. Even at this early stage, this could arguably represent a musification as each frame has a resulting pitch index (and a derivable absolute frequency), but the resulting notes are closer to a linear sonification when they are not further quantised to specific keys and pitch ranges. An example of resulting pitch index and octave number from frame weightings are shown in Tab. 1.
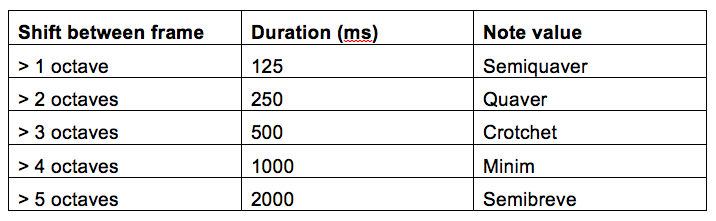
Secondly, duration features are calculated from the average shift between each frame, whereby larger shifts are represented by longer note values. Again there is a compromise to be made by the designer between a linear, utilitarian approach, and a more creative mapping with specific musical intent. In this case, a set of five discreet durations was defined in order to obtain more consistent rhythmic patterns. The values for each frame are mapped to five durations in milliseconds, which correspond to the various note values at 120 beats per minute. As shown in Tab. 2 a practical range of musical note values can be achieved in this manner, but a more complicated mapping schema would be required in order to achieve dotted notes and other rhythmic articulations.
The duration values can be subject to additional quantisation (to fit specific time signatures) and are then combined with the pitch mappings to create rhythmic features. The duration quantisation is specified with a utilitarian intent such that note streams are subjected to an increasingly large amount of rhythmic quantisation in sequences were there is little or no movement in a frame, creating long note durations and legato envelopes which are used to create chords. In a chord instance, all of the notes from a subsequent stream are summed and played simultaneously. The amount of quantisation is gradually reduced when more movement is present in the dataset.
Thirdly, amplitude envelope is determined according to a convolution of the weighting factor (n) for each frame with the final value (z) in the data source (the wavelet amplitude), for each kth frame, velocity, v = (z*n)k. As with the duration mapping, a number of musical amplitude envelopes can be achieved in this manner, but more complicated envelope articulations (for example staccato markings) would require further levels of mapping.
The resulting melodies could then be performed by digital synthesis (or rendered as a score for human performance), but in this schema they are further mediated by pitch quantisation, by means of an algorithm that maps the incoming notes to various modal scales. This feature was implemented in order to adhere to the fourth and fifth system criteria; the requirement to be both audibly “pleasant” and complimentary to a visual analysis (primum non nocere), under the premise that most listeners working with this type of tool in the real world would find tonal music both familiar and less distracting from the visual stimulus than, for example, chromatic twelve-tone or other structural rulesets which might perhaps create more attention-grabbing musical work. Similarly we rely on the assumption that the end listener will have preconceived notions about tonal music that will aid the utility of the mapping if these expectations are incorporated, and compromised in the case of causing alarm. Therefore, if any alteration in clockwise/anticlockwise motion is detected in the swimming motion of the flagellar, a specific pitch modulation is engaged (see Williams & Wilson (2015a) for full details of this process). The modulation is clearly audible to the listener and creates delineation in the data set in order to prompt further visual analysis.
Thus this system was capable of generating novel musical score to synchronously accompany a 3D visual display from the flagellar motility. Example scores are presented in Williams & Wilson (2015b).
Audio 1 - example musification of 300 frames of P. berghei motility data rendered as audio via a virtual piano voice.
Criteria and methodologies for evaluation of auditory display vary (Degara et al., 2013; Hermann et al., 2011; Vogt et al., 2013), and indeed evaluations of mapping strategies are not often performed (Dubus & Bresin, 2013). The lack of a universal method for evaluation is a contributor to this problem (Ibrahim et al., 2011) but systems which do not directly require utility (creative approaches) have no explicit need of evaluation other than that of the designers own aesthetic goals. Unlike a solely creative musification, this system was also designed with some deliberately utilitarian applications in mind as outlined in response to the criteria for utility. Therefore a methodology for evaluating the potential of the system with regards to this functionality was required in order to determine the actual utility of the system.
The system was subjected to analysis by means of a multi-criteria decision aid after previous work evaluating sonifications in such a manner (Vogt, 2011), by asking participants to rate the musification system in direct comparison with the visual display and a randomised accompaniment, across five evenly weighted criteria which were chosen as contributory factors to overall system utility: amenity (was the musification audibly “pleasant”), immersion (were listeners able to give the data their full attention), intuitivity (how readily analysable was the resulting musification with no specific training), efficiency (how quickly could listeners identify a change in flagellar movement using the musification), and congruency (how aesthetically appropriate the musification was when presented synchronously with the visual representation). The randomised accompaniment was generated by modulating pitch, duration, and dynamic values from the first stage of the mapping (prior to any quantisation) with a random number generator before scaling to the same set of values as the input, creating a mainly asynchronous stream of notes across the same octave values as the musification. Without the insertion of the random number modulation, the sounds generated at this stage might be considered a traditional (synchronous) sonification, which would also be useful in future evaluation strategies in order to determine whether listeners prefer musification over sonification alarm cues. The randomised accompaniment generated here was rated lowest across all criteria. Listeners consistently rated the amenity intuitivity and congruency of the musification above that of the visual only display, however, the visual only display achieved higher ratings for immersion. There was no significant difference found between the visual only display and the musification in terms of how efficient listeners felt the musification was (Williams & Wilson, 2015a). These findings suggest that adopting a musification as a complimentary data presentation technique with existing visual presentation gave an amenable and congruent display, but was also somewhat distracting (inferred from the decreased immersion when the musification was presented synchronously with the visual display).
We consider the difference between a musification and a sonification as the deliberate specification of musically intentioned constraints at the mapping stage. This can be conducted with creative or utilitarian motives though these need not be mutually exclusive.
Musification can facilitate engagement with complex data streams – as in the biomedical example given here – exploiting listeners’ prior experience with music as an automatic and intuitive cognitive process in day-to-day life. The musification we presented here evaluated a series of creative decisions (related to lower level musical features such as pitch, note duration, and amplitude envelope, and higher level features such as particular rhythmic sequences, melodic contours, and the occurance of chord sequences) according to the ultimate utility of the resulting musical performance. Changes in the direction of flagellar movement in the source dataset which might otherwise be obscured by the visual illusion of clockwise/anticlockwise movement are represented by musical modulations by quantizing pitch values to specific scales and modes, beyond that of the first level of mode quantisation. Four “types” of scale are possible: Chromatic, Pentatonic, Major and Harmonic Minor. These scale types can also be transposed so that all keys can be achieved, there is no need to list modes separately because as far as pitch class content is concerned the modes are identical to the parent scale. In other words the only difference between C major and G mixolydian is which note the scale begins on (which is determined by the incoming note stream, whilst the pitch class content is identical in both cases). Thus the type of modulation which is achieved when a change of direction occurs is relative to the starting note in the existing data stream.
The resulting musical sequences would be relatively difficult to perform for a human musician, as can be heard in the audio example provided, even though they may sound aesthetically convincing to a non-musical audience.
We consider the utility of such techniques as a parameter for the evaluation of mapping strategies as comprised of a number of perceptual characteristics, including amenity, congruence, intuitivity and ease-of-use. A previous evaluation revealed that listeners consistently rated the amenity intuitivity and congruency of this musification above that of the visual only display and that of a randomised accompaniment. Therefore the utility of the particular system in question, regardless of the creative musical decisions that were made in the specification and design, was encouraging. This is a finding which suggests that in future the opportunity for creative expression in the design of such systems does not need to be mutually exclusive to the utility of an end use in cases where musification offers possible advantages over other types of data presentation. However, the system should be evaluated against synchronous sonification techniques (without deliberately musical quantisation) to best determine the amenity of musification over sonification in such cases – listeners might prefer simple audio cues. Moreover, the system could be significantly improved both in terms of its creative potential and its ultimate utility by considering higher level structural and timbral features, which are often shown to make strong contributions to listener perception in analyses of computer generated scores. At present the resulting musical features are rendered by simple synthesis. In further work considering timbral features, a third layer of mapping between the input parameters and spectro-temporal control of wavelet synthesis would allow for specific control of timbral features in the resulting musical performance. The opportunity to design such a system is unique to the computer music field – designing score for real-world musicians to perform according to spectro-temporal analysis is a challenge for composers at all levels and well beyond the scope of this work.
This area remains an exciting and challenging area for further work developing practical and creative systems for musification. There is also the potential to develop a system that processes pre-recorded audio streams (for example the user’s own selection of music) in real time by applying selective filtering or phasing to a playback stream when flagellar movement in the correct direction is identified, for example. We consider this an additional area for further work particularly relevant to the criteria of in-field analysis and a system which might musify the data whilst still satisfying the criteria for “pleasant” listening experience and mediating the potential confound of individual musical preference.